 DayPilot
The JavaScript Gantt chart combines progressive row, task, grid-cell and time-header rendering for large projects and long timelines. These mechanisms build the visible part of the plan as users scroll, reducing the number of browser elements needed at once.
Progressive Row Rendering
Progressive row rendering prepares task-row headers for the visible area and a surrounding buffer. Headers that move beyond that area can be removed from the browser while the loaded task hierarchy remains available.
The example contains 10,000 loaded rows organized into 100 projects and is scrolled to project 038. Users can navigate the task tree without requiring every row header to be displayed at once.
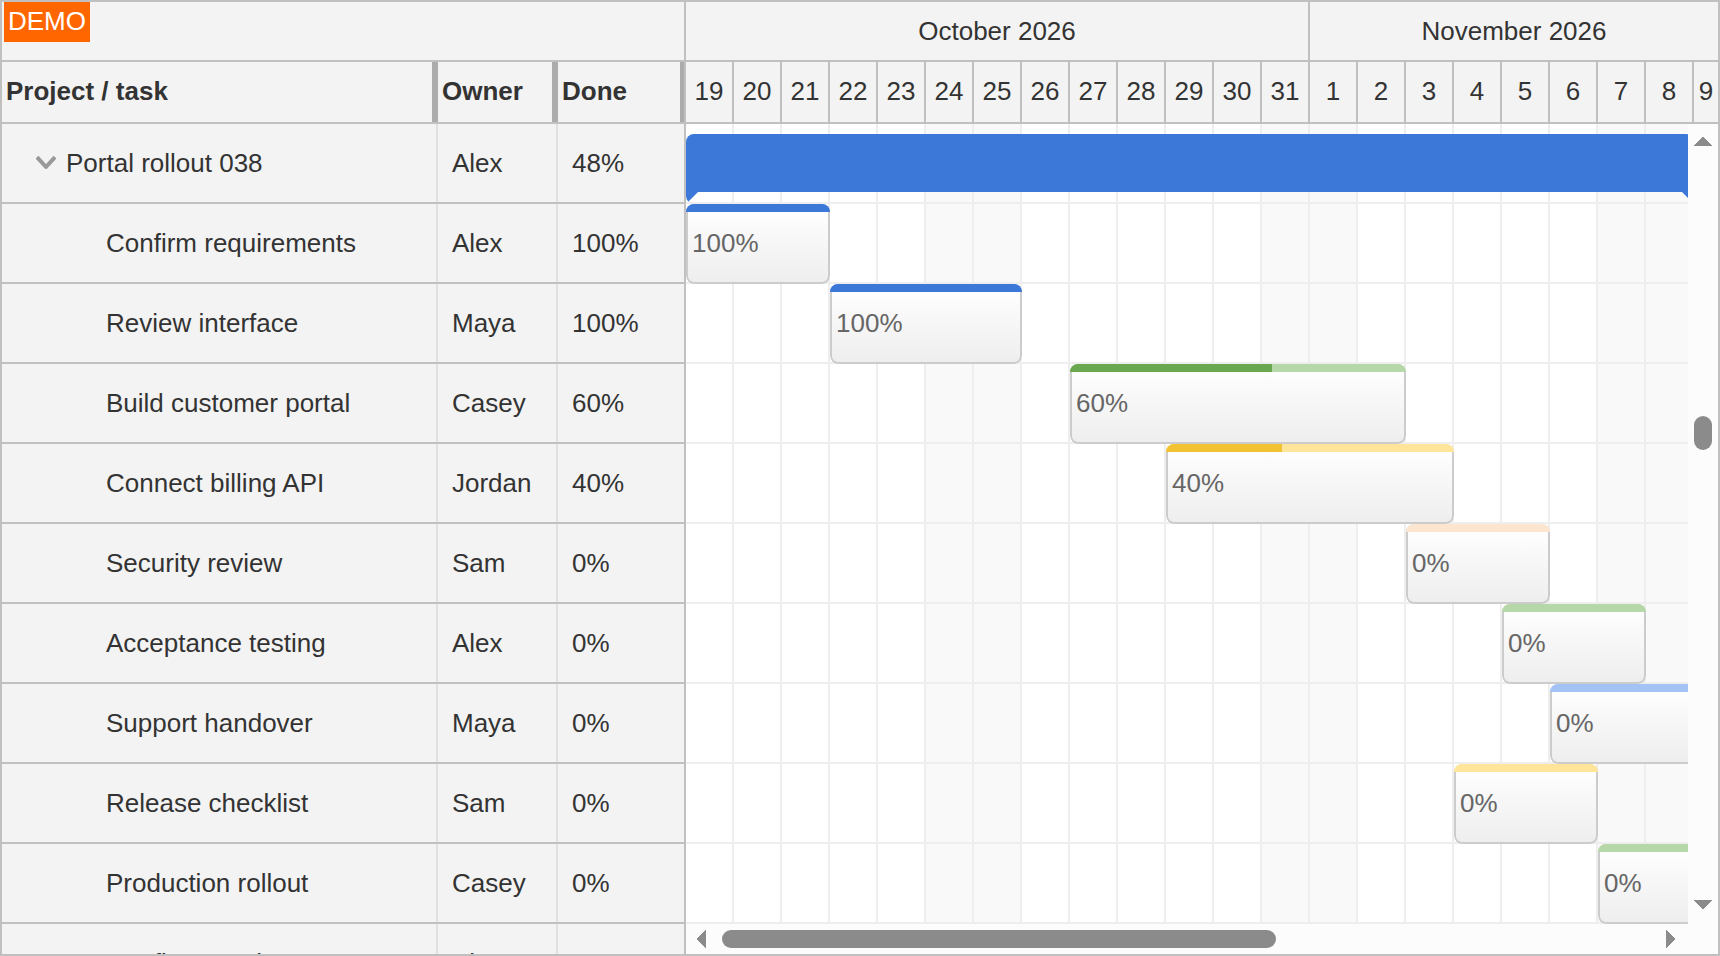
Explore the 10,000-task demo to see a large loaded project in action.
Progressive Task Rendering
Progressive task rendering applies the same principle to task boxes. It prepares tasks near the viewport as users scroll through rows or dates, so work outside the displayed area does not require a full set of task elements.
Task rendering and row-header rendering address different parts of the chart and work together. A project can have many rows, tasks distributed over a long period, or both. Custom task and row content remains part of the rendering workload.
Progressive Cell Rendering
Progressive cell rendering limits the timeline grid elements to the displayed area. Cells outside the current viewport are removed as the user scrolls. This avoids creating the complete task-by-time grid for a project with many rows and a detailed time scale.
Progressive Time-Header Rendering
A long date range also needs efficient headers. Progressive time-header rendering prepares date-header cells near the viewport rather than creating every header at initialization. It is enabled by default in current versions and works alongside task and grid rendering.
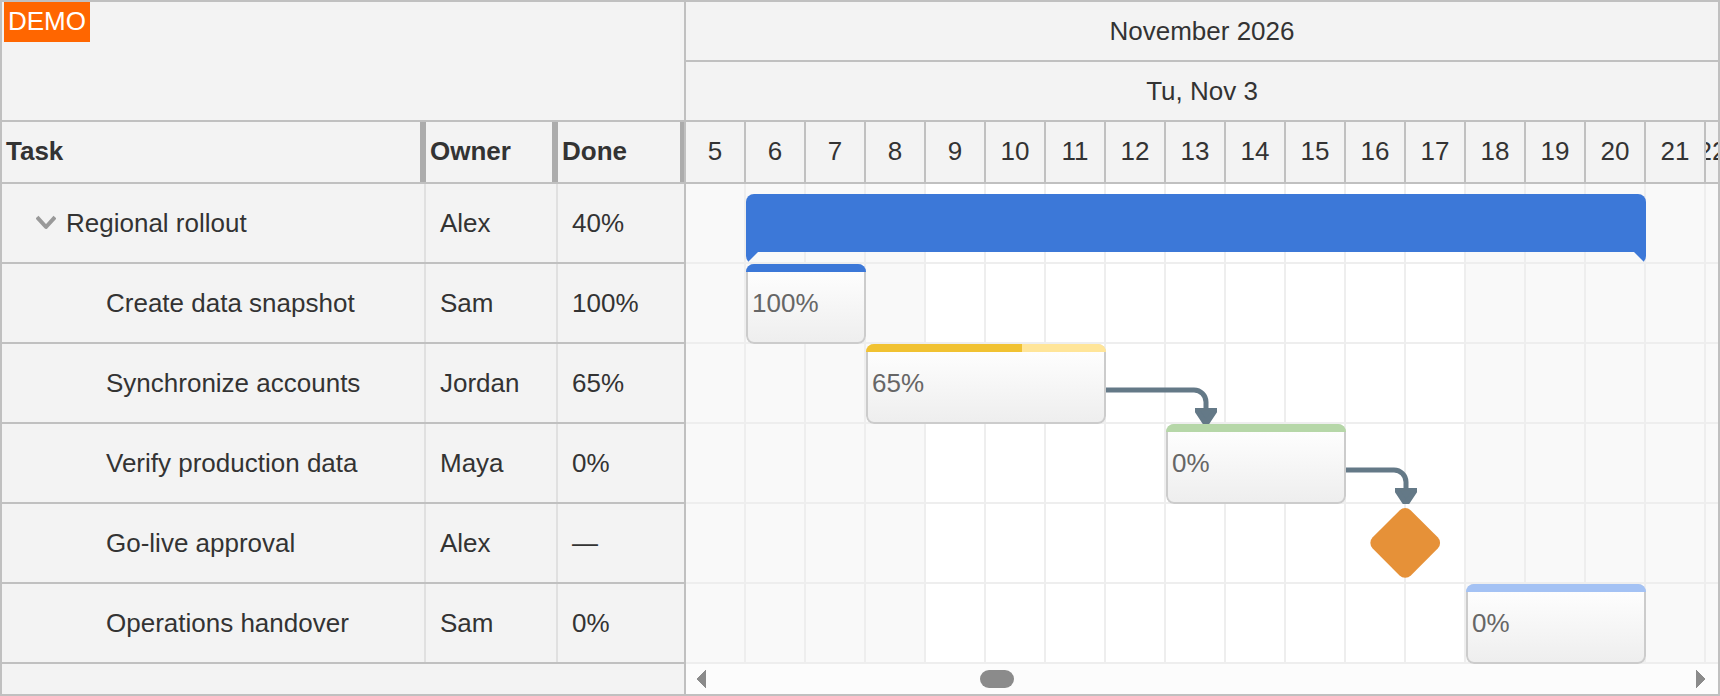
The example uses hourly cells across a three-year timeline, scrolled to a November 2026 rollout. The long-timeline demo lets users compare scales and jump between distant parts of the plan without discarding the overall planning horizon.
Rendering and Project Data
Progressive rendering controls what is drawn. It does not automatically fetch more tasks from a server. Your application loads the task tree and dependencies, chooses the projects to include and saves edits through its own API.
The rendering mechanisms can support different project sizes and timeline resolutions, but there is no single task-count guarantee for every application. Actual hierarchy depth, custom content, data volume and user devices all affect performance. The demos provide representative workloads to explore alongside your own project data.
See the project-management overview for the task model and the drag-and-drop overview for interactive planning.